
Statistics and Data Handling Crossword Puzzle
Download and print this "Statistics and Data Handling" crossword puzzle, or solve it online directly in your browser. For the printable version, use a pencil or pen to fill in the answers. The completed answers are included, so you can easily check your work when you're finished.
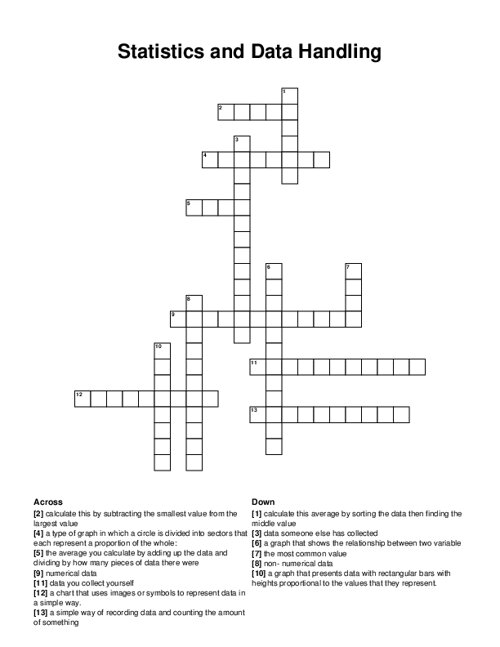
PDF will include puzzle sheet and the answer key.
Related puzzles:
More Business / Finance Crossword Puzzles
Industrial Revolution and Imperialism
An Entrepreneur
Advertising Techniques
Money Banking
Property Management
Browse all Business / Finance Puzzles
QUESTIONS LIST:
- mean: the average you calculate by adding up the data and dividing by how many pieces of data there were
- range: calculate this by subtracting the smallest value from the largest value
- median: calculate this average by sorting the data then finding the middle value
- mode: the most common value
- qualitative: non- numerical data
- quantitative: numerical data
- primary data: data you collect yourself
- secondary data: data someone else has collected
- pie chart: a type of graph in which a circle is divided into sectors that each represent a proportion of the whole:
- bar graph: a graph that presents data with rectangular bars with heights proportional to the values that they represent.
- tally chart: a simple way of recording data and counting the amount of something
- pictogram: a chart that uses images or symbols to represent data in a simple way.
- scatter graph: a graph that shows the relationship between two variable
