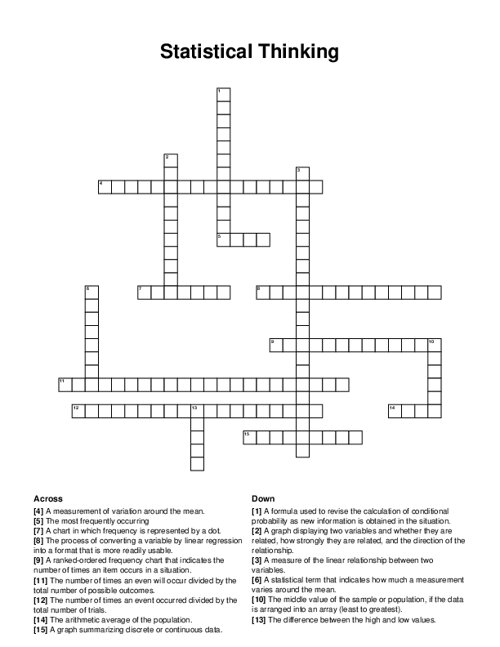
Statistical Thinking Crossword Puzzle
Download and print this Statistical Thinking crossword puzzle. Use a pencil or pen to complete the puzzle by filling in the blanks. The completed answers are included, so you can easily check your progress.
PDF will include puzzle sheet and the answer key.
Related puzzles:
More Business / Finance Crossword Puzzles
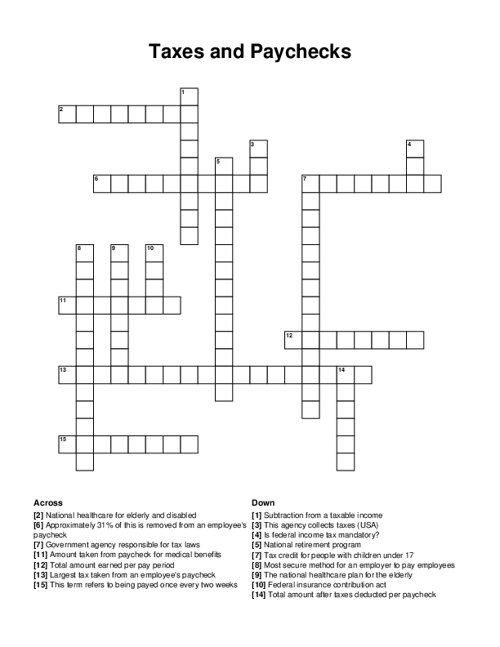
Taxes and Paychecks
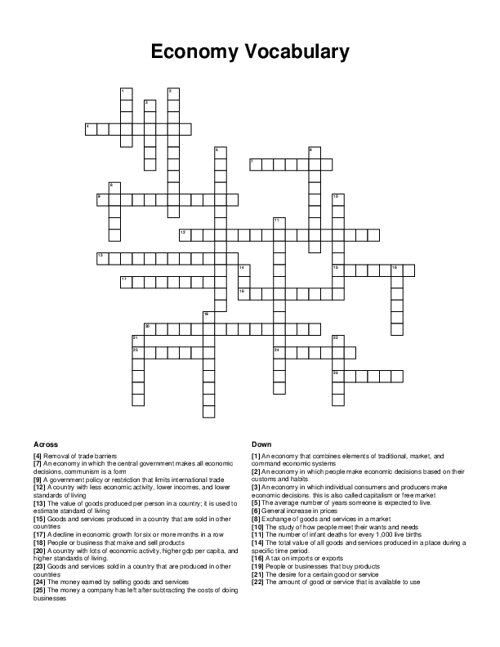
Economy Vocabulary
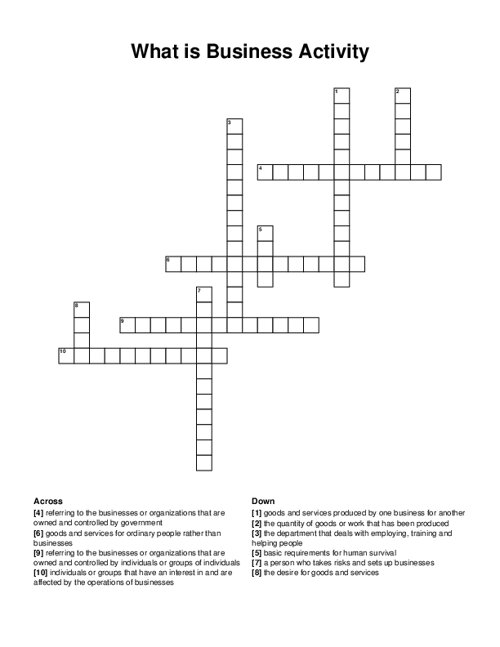
What is Business Activity
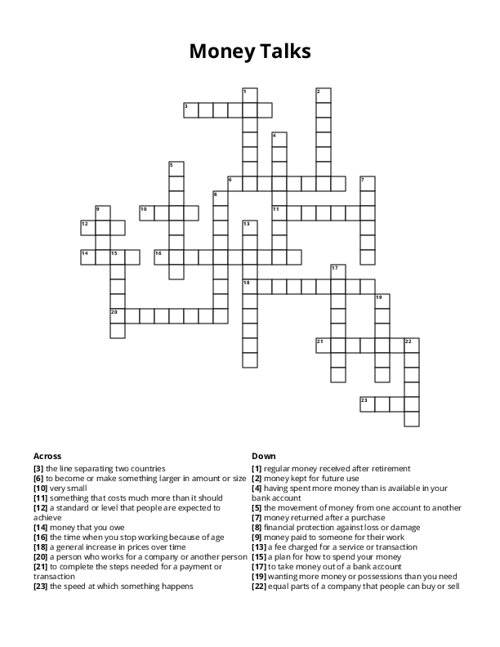
Money Talks
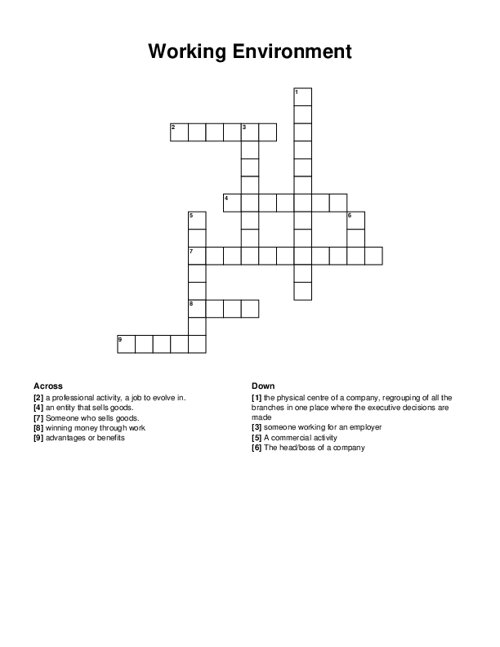
Working Environment
Browse all Business / Finance Puzzles
QUESTIONS LIST:
- coefficient correlation : a measure of the linear relationship between two variables.
- mean : the arithmetic average of the population.
- transformation : the process of converting a variable by linear regression into a format that is more readily usable.
- dot plot : a chart in which frequency is represented by a dot.
- range : the difference between the high and low values.
- bayes theorem : a formula used to revise the calculation of conditional probability as new information is obtained in the situation.
- standard deviation : a measurement of variation around the mean.
- scatter plot : a graph displaying two variables and whether they are related, how strongly they are related, and the direction of the relationship.
- observed probability : the number of times an event occurred divided by the total number of trials.
- variance : a statistical term that indicates how much a measurement varies around the mean.
- histogram : a graph summarizing discrete or continuous data.
- theoretical probability : the number of times an even will occur divided by the total number of possible outcomes.
- pareto diagram : a ranked-ordered frequency chart that indicates the number of times an item occurs in a situation.
- mode : the most frequently occurring
- median : the middle value of the sample or population, if the data is arranged into an array (least to greatest).