Document Creating and Editing Crossword Puzzle
Download and print this Document Creating and Editing crossword puzzle.
Browse all Business / Finance Puzzles
QUESTIONS LIST:
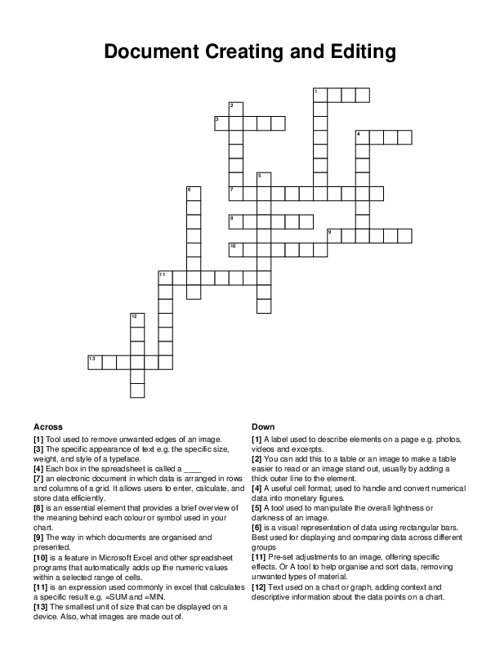
- layout: the way in which documents are organised and presented.
- fonts: the specific appearance of text e.g. the specific size, weight, and style of a typeface.
- captions: a label used to describe elements on a page e.g. photos, videos and excerpts.
- borders: you can add this to a table or an image to make a table easier to read or an image stand out, usually by adding a thick outer line to the element.
- crop: tool used to remove unwanted edges of an image.
- pixels: the smallest unit of size that can be displayed on a device. also, what images are made out of.
- brightness: a tool used to manipulate the overall lightness or darkness of an image.
- spreadsheet: an electronic document in which data is arranged in rows and columns of a grid. it allows users to enter, calculate, and store data efficiently.
- cell: each box in the spreadsheet is called a _
- filters: pre-set adjustments to an image, offering specific effects. or a tool to help organise and sort data, removing unwanted types of material.
- currency: a useful cell format, used to handle and convert numerical data into monetary figures.
- formulae: is an expression used commonly in excel that calculates a specific result e.g. =sum and =min.
- autosum: is a feature in microsoft excel and other spreadsheet programs that automatically adds up the numeric values within a selected range of cells.
- bar chart: is a visual representation of data using rectangular bars. best used for displaying and comparing data across different groups
- labels: text used on a chart or graph, adding context and descriptive information about the data points on a chart.
- legend: is an essential element that provides a brief overview of the meaning behind each colour or symbol used in your chart.
