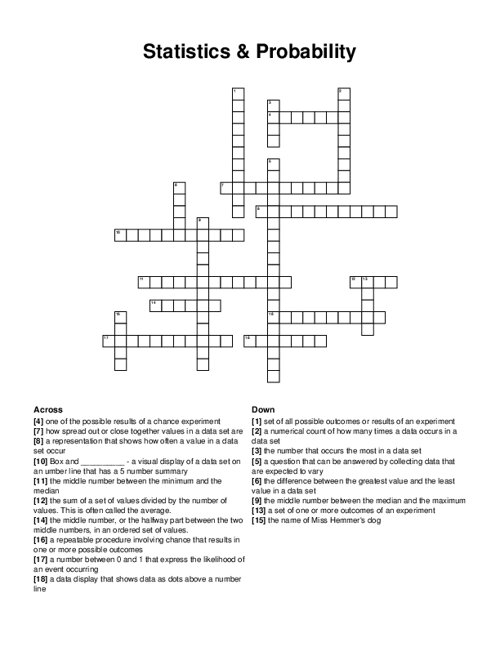
Statistics & Probability Crossword Puzzle
Download and print this Statistics & Probability crossword puzzle. Use a pencil or pen to complete the puzzle by filling in the blanks. The completed answers are included, so you can easily check your progress.
PDF will include puzzle sheet and the answer key.
Related puzzles:
More Kids / School Crossword Puzzles
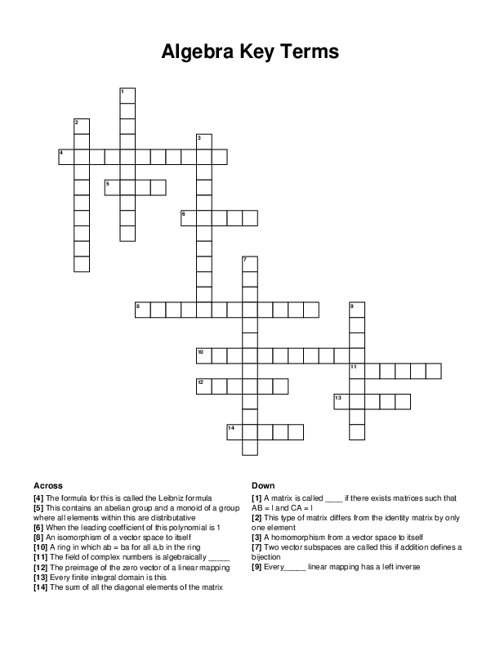
Algebra Key Terms
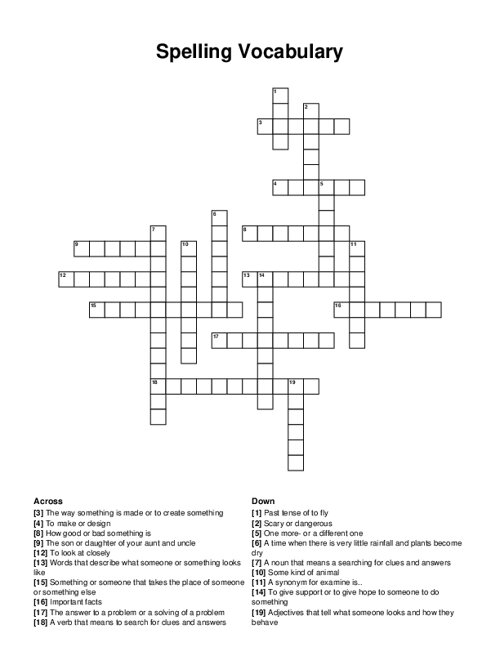
Spelling Vocabulary
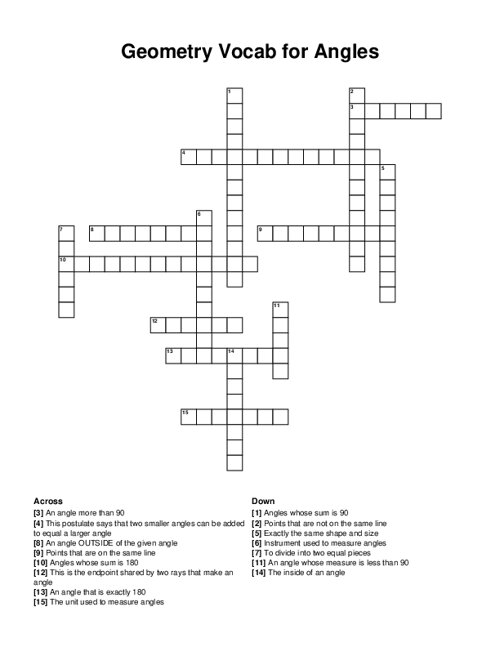
Geometry Vocab for Angles
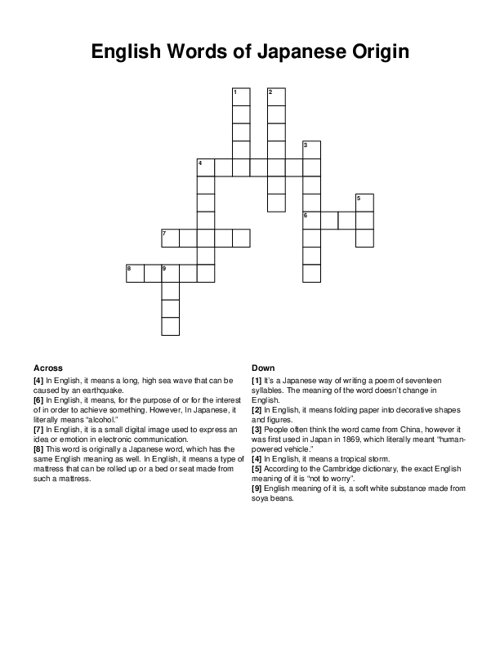
English Words of Japanese Origin
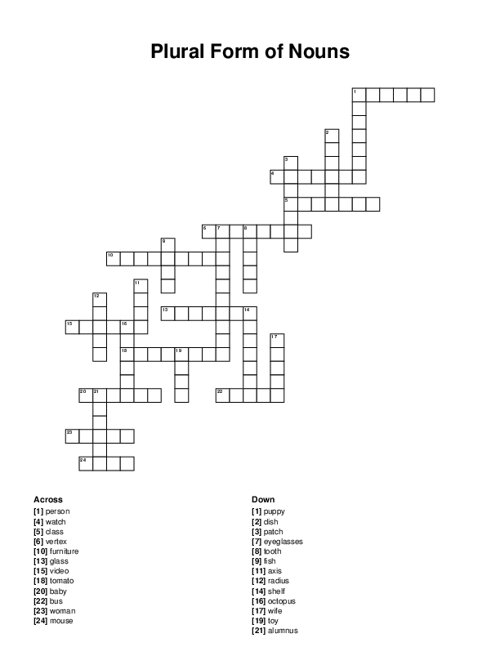
Plural Form of Nouns
Browse all Kids / School Puzzles
QUESTIONS LIST:
- statistical question: a question that can be answered by collecting data that are expected to vary
- dot plot: a data display that shows data as dots above a number line
- whisker plot: box and _ - a visual display of a data set on an umber line that has a 5 number summary
- distribution: a representation that shows how often a value in a data set occur
- frequency: a numerical count of how many times a data occurs in a data set
- variability: how spread out or close together values in a data set are
- mean: the sum of a set of values divided by the number of values. this is often called the average.
- median: the middle number, or the halfway part between the two middle numbers, in an ordered set of values.
- range: the difference between the greatest value and the least value in a data set
- mode: the number that occurs the most in a data set
- lower quartile: the middle number between the minimum and the median
- upper quartile: the middle number between the median and the maximum
- probability: a number between 0 and 1 that express the likelihood of an event occurring
- outcome: one of the possible results of a chance experiment
- experiment: a repeatable procedure involving chance that results in one or more possible outcomes
- event: a set of one or more outcomes of an experiment
- harry: the name of miss hemmer's dog
- sample space: set of all possible outcomes or results of an experiment