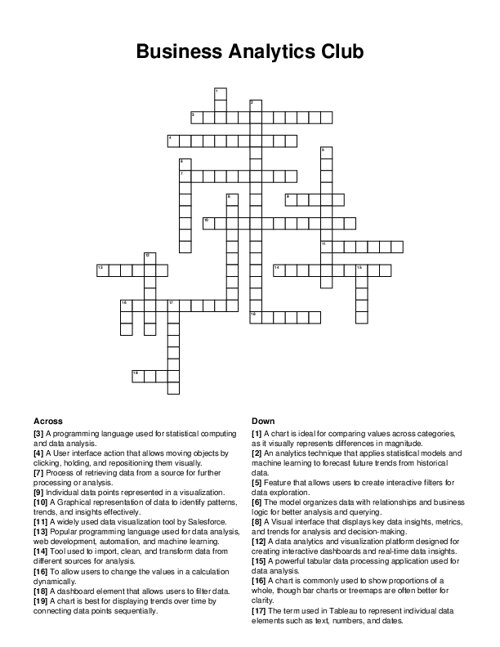
Business Analytics Club Crossword Puzzle
Download and print this Business Analytics Club crossword puzzle.
Browse all Business / Finance Puzzles
QUESTIONS LIST:
- excel : a powerful tabular data processing application used for data analysis.
- tableau : a widely used data visualization tool by salesforce.
- r programming : a programming language used for statistical computing and data analysis.
- predictive analytics : an analytics technique that applies statistical models and machine learning to forecast future trends from historical data.
- powerbi : a data analytics and visualization platform designed for creating interactive dashboards and real-time data insights.
- power query : tool used to import, clean, and transform data from different sources for analysis.
- bar : a chart is ideal for comparing values across categories, as it visually represents differences in magnitude.
- line : a chart is best for displaying trends over time by connecting data points sequentially.
- pie : a chart is commonly used to show proportions of a whole, though bar charts or treemaps are often better for clarity.
- python : popular programming language used for data analysis, web development, automation, and machine learning.
- visualization : a graphical representation of data to identify patterns, trends, and insights effectively.
- drag and drop : a user interface action that allows moving objects by clicking, holding, and repositioning them visually.
- extracting : process of retrieving data from a source for further processing or analysis.
- semantic : the model organizes data with relationships and business logic for better analysis and querying.
- slicer : a dashboard element that allows users to filter data.
- dashboards : a visual interface that displays key data insights, metrics, and trends for analysis and decision-making.
- measures : the term used in tableau to represent individual data elements such as text, numbers, and dates.
- marks : individual data points represented in a visualization.
- parameters : to allow users to change the values in a calculation dynamically.
- quick filters : feature that allows users to create interactive filters for data exploration.
