Excel: Formulas, Functions, and Charts Crossword Puzzle
Download and print this Excel: Formulas, Functions, and Charts crossword puzzle.
Related puzzles:
Browse all Computers / IT Puzzles
QUESTIONS LIST:
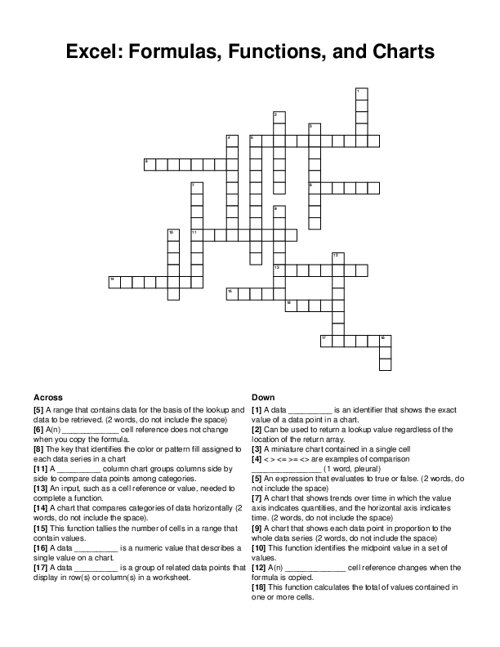
- legend: the key that identifies the color or pattern fill assigned to each data series in a chart
- spark line: a miniature chart contained in a single cell
- pie chart: a chart that shows each data point in proportion to the whole data series (2 words, do not include the space)
- point: a data _ is a numeric value that describes a single value on a chart.
- series: a data _ is a group of related data points that display in row(s) or column(s) in a worksheet.
- clustered: a _ column chart groups columns side by side to compare data points among categories.
- bar chart: a chart that compares categories of data horizontally (2 words, do not include the space).
- line chart: a chart that shows trends over time in which the value axis indicates quantities, and the horizontal axis indicates time. (2 words, do not include the space)
- label: a data _ is an identifier that shows the exact value of a data point in a chart.
- absolute: a(n) _ cell reference does not change when you copy the formula.
- argument: an input, such as a cell reference or value, needed to complete a function.
- lookup table: a range that contains data for the basis of the lookup and data to be retrieved. (2 words, do not include the space)
- relative: a(n) _ cell reference changes when the formula is copied.
- logical test: an expression that evaluates to true or false. (2 words, do not include the space)
- x lookup: can be used to return a lookup value regardless of the location of the return array.
- sum: this function calculates the total of values contained in one or more cells.
- count: this function tallies the number of cells in a range that contain values.
- median: this function identifies the midpoint value in a set of values.
- operators: < > <= >= <> are examples of comparison _ (1 word, pleural)
