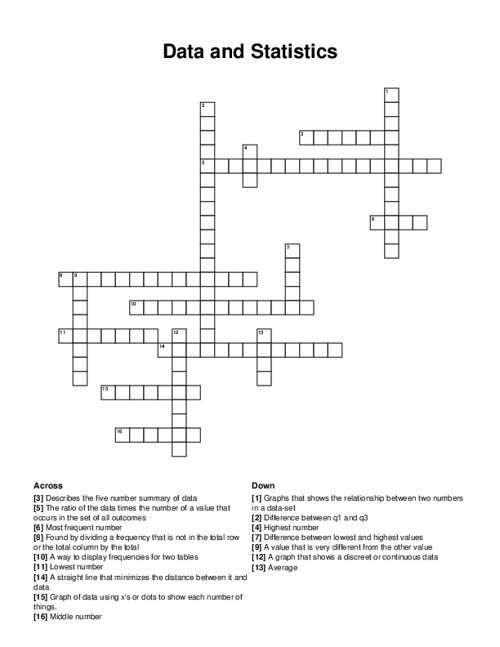
Data and Statistics Crossword Puzzle
Download and print this Data and Statistics crossword puzzle. Use a pencil or pen to complete the puzzle by filling in the blanks. The completed answers are included, so you can easily check your progress.
PDF will include puzzle sheet and the answer key.
Related puzzles:
More Educational Crossword Puzzles

Angle Relationships
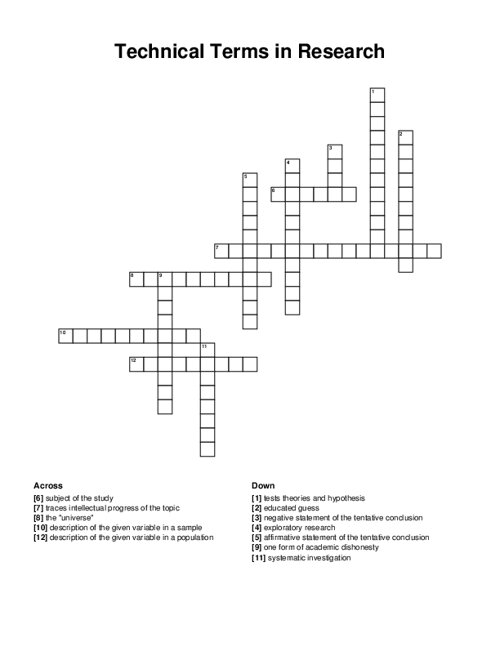
Technical Terms in Research
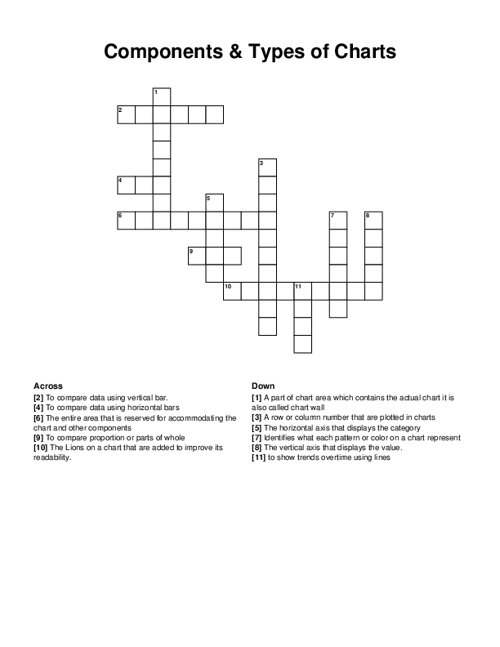
Components & Types of Charts
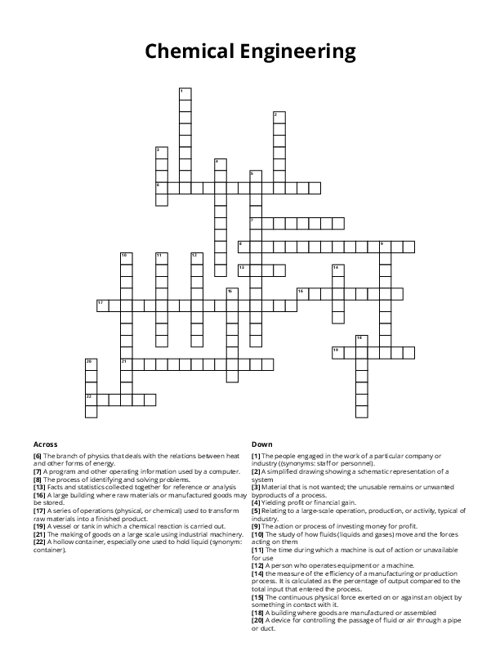
Chemical Engineering
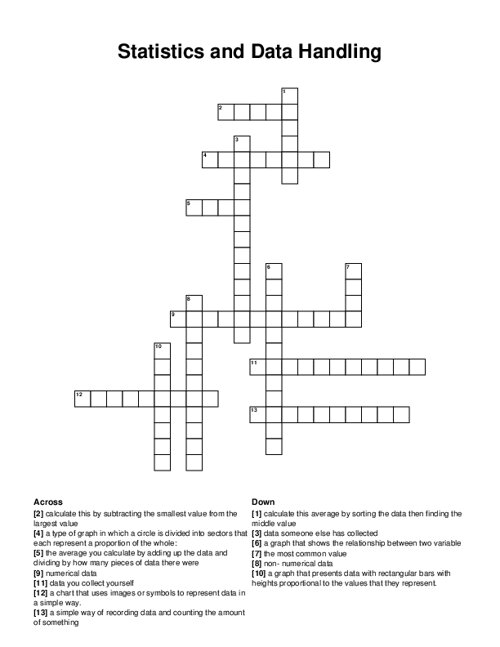
Statistics and Data Handling
Browse all Educational Puzzles
QUESTIONS LIST:
- joint frequency : found by dividing a frequency that is not in the total row or the total column by the total
- mean : average
- box plot : describes the five number summary of data
- line of best fit : a straight line that minimizes the distance between it and data
- two-way tables : a way to display frequencies for two tables
- outliers : a value that is very different from the other value
- minimum : lowest number
- max : highest number
- interquartile range : difference between q1 and q3
- median : middle number
- mode : most frequent number
- dot plot : graph of data using x's or dots to show each number of things.
- range : difference between lowest and highest values
- scatter plots : graphs that shows the relationship between two numbers in a data-set
- histogram : a graph that shows a discreet or continuous data
- relative frequency : the ratio of the data times the number of a value that occurs in the set of all outcomes